

How to use Content Harmony's Google Docs Add-On
Docs Nov 13, 2023 • 1 min read
N-Gram Viewer & Analysis Tool
Tools Sep 27, 2023 • 3 min read
Strikethrough Text Generator (Easily Cross Out Text)
Tools Sep 26, 2023 • 3 min read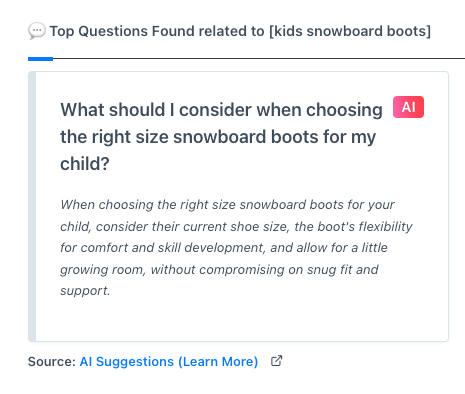
AI Suggested Questions
Updates Jun 20, 2023 • 2 min read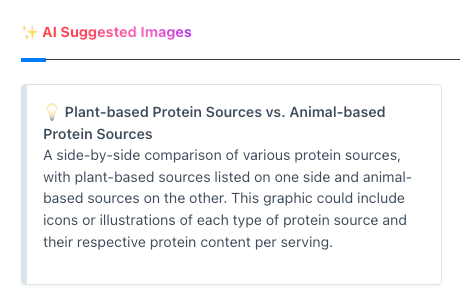
AI Suggested Images
Updates Apr 19, 2023 • 3 min read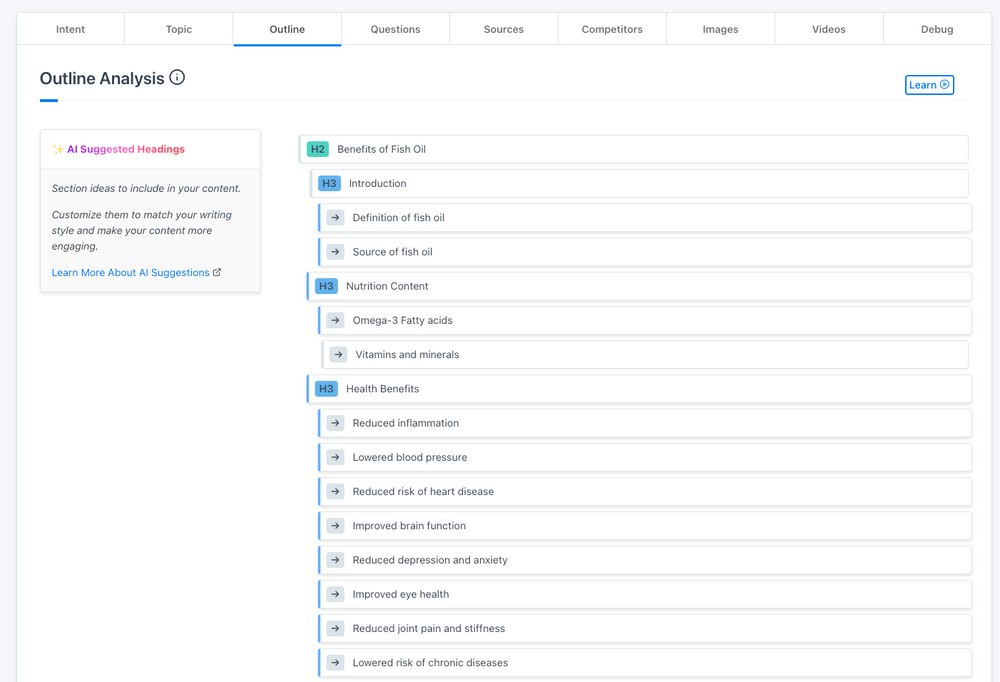
Introducing AI Suggestions To Content Harmony
Updates Mar 28, 2023 • 2 min read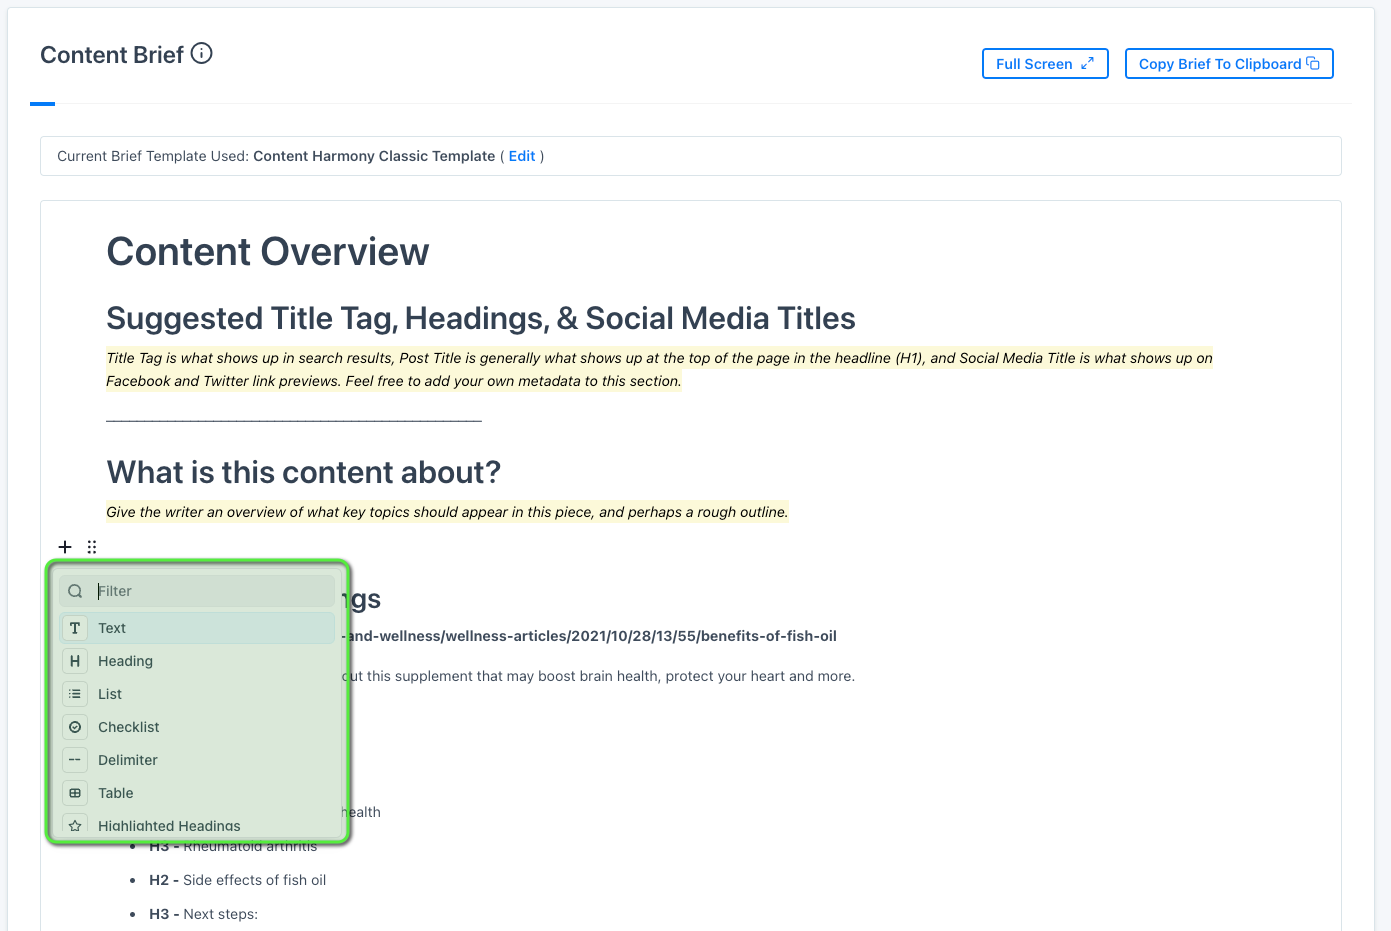
Announcing Our New Content Brief Editor
Updates Sep 19, 2022 • 2 min read
The Keyword Difficulty Myth
Articles Sep 15, 2022 • 50 min read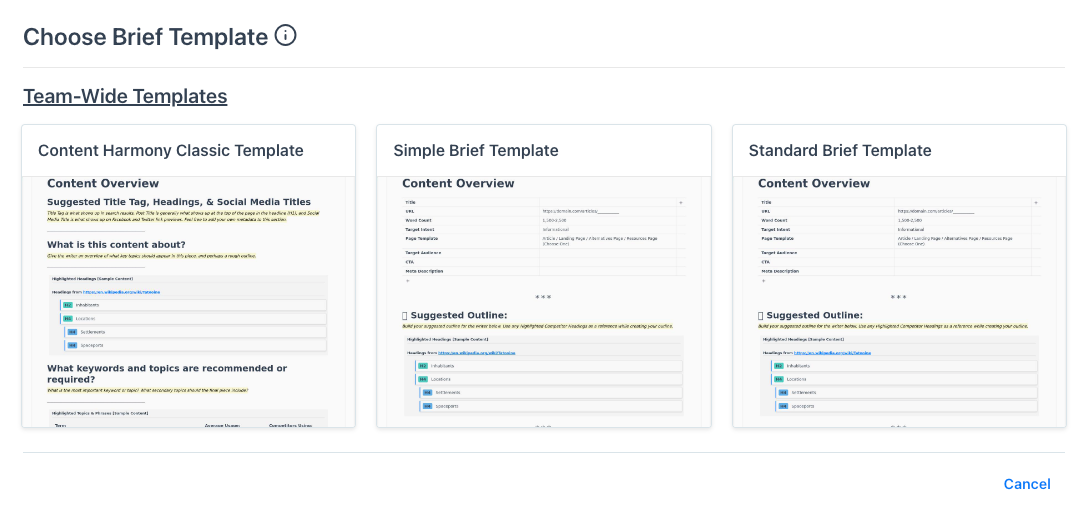
Content Brief Templating Software
Features Sep 09, 2022 • 3 min read
Brand Philosophy
Brand Guidelines Hub Apr 28, 2022 • 1 min read
Voice & Tone Guidelines
Brand Guidelines Hub Apr 26, 2022 • 4 min read
Editorial Guidelines
Brand Guidelines Hub Apr 26, 2022 • 5 min read
Our Audience
Brand Guidelines Hub Apr 26, 2022 • 3 min read
Style Guide & Word List
Brand Guidelines Hub Apr 26, 2022 • 2 min read
Visual Guidelines
Brand Guidelines Hub Apr 26, 2022 • 4 min read
Web Elements
Brand Guidelines Hub Apr 26, 2022 • 2 min read
How to Export Content Harmony's Topic Model
Docs Apr 20, 2022 • 2 min read
Content Marketing Roles
Articles Mar 29, 2022 • 20 min read
Where can I find Content Harmony invoices and receipts?
Docs Mar 18, 2022 • 1 min read
The Content Optimization Framework: [Intent > Topic > UX]
Articles Feb 15, 2022 • 17 min read
How to move Briefs & Reports between Projects
Docs Feb 08, 2022 • 1 min read
How To Update & Refresh Old Website Content (And Why)
Articles Feb 07, 2022 • 13 min read