When we used to be an agency, we would kick off with clients who had been around for more than a few years and already have some decent content on their website.
One of the fastest wins in that situation is to find opportunities to identify old content that is underperforming, improve the content, and see fast improvements on traffic.
Improving outdated or poorly written content probably made up 15% of the work for one of our past case studies as an agency, and produced 30-40% of the first 6 months of results.
We have learned the hard way that when you’re kicking off a 6-month project with a high monthly budget, nothing makes clients more squirmy than getting 3-5 months in without some of these noticeable wins. And when most of our work involves publishing new content, it often takes 4-12 months for a content asset to (A) start ranking on page 1-2, and (B) move up enough on page 1 to start actually seeing some clicks and not just Search Console impressions.
Naturally, you’re often going to want to be looking for new keyword opportunities that a website hasn’t covered yet – that is covered by a separate Gap Analysis which we’ll cover in a future post.
A Quick Wins analysis is completely focused on improvements we can make to the existing content on the site to get better performance out of what we already have.
“Hey Man, This Is Basic Keyword Research & SEO Stuff”
True!
Doing a quick wins review at the beginning of an SEO or marketing engagement isn’t especially innovative – lots of agencies do this and lots of people have documented similar processes to the one I describe below for quick wins. (Here are 3 solid examples from BuiltVisible, From The Future, and Kevin Gibbons). And most SEOs have seen some version of this analysis over the years with SEMRush data being the classic source.
So the quick wins analysis alone isn’t what I’m focused on here. This tutorial exists to solely focus on the content marketing aspects of the quick wins review (so I’m not going to cover things like easy technical SEO fixes, or fixing broken links to your site).
More importantly – it also focuses more heavily on the outcomes of the quick wins review – how we approach improving content to actually take advantage of the opportunity we just identified. We’re going to go beyond looking at keyword opportunities and look at a methodology for how to effect change on the URLs where we identify potential.
So – with that said, here’s the process we’ve used with success multiple times:
- Build a Quick Wins report using link metrics, rankings, and conversion values.
- Prioritize opportunity based upon volume or value.
- Review content and identify improvements needed.
- Improvements: Improve the content itself (Easier).
- Improvements: Build new internal links (Easier).
- Improvements: Build new external links (Harder).
Let’s jump in:
Step 1: Build The Quick Wins Report:
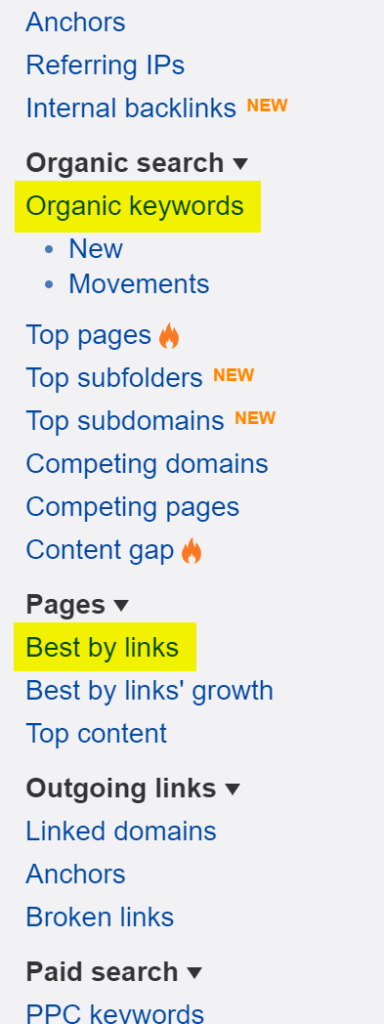
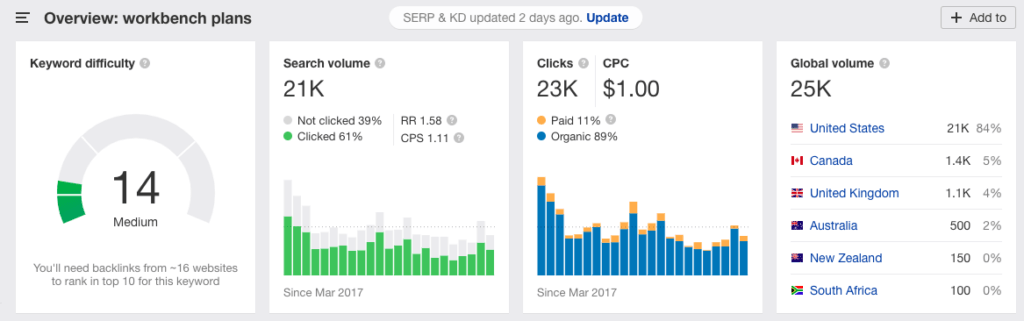
1) Pull full list of Organic Keywords the site ranks for from Ahrefs.
If the list is really large, sort by keywords where position is <30. If that’s still too large, filter by other factors you care about until the list is small enough to export in 1-5 CSV chunks.
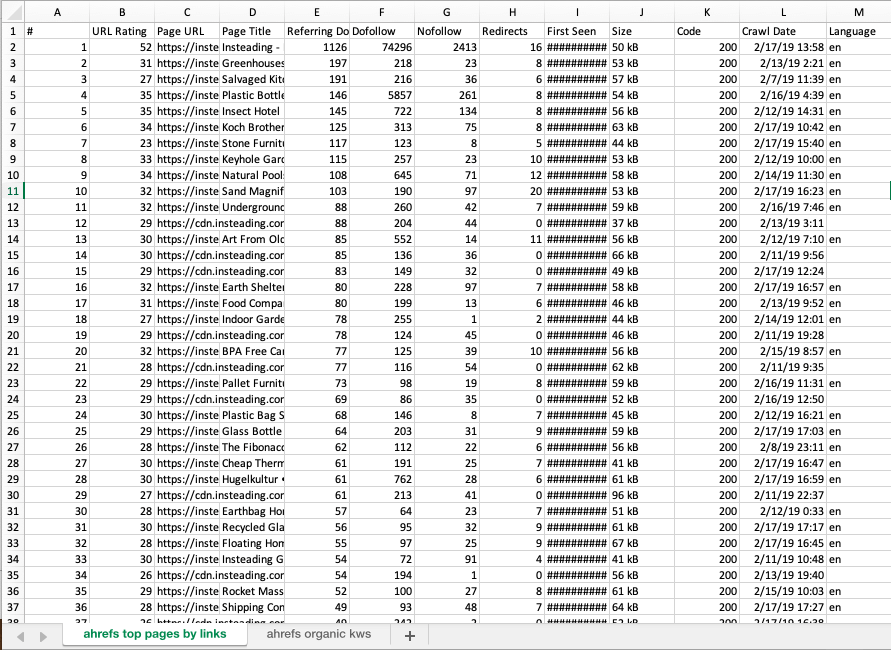
2) Pull full list of Best Pages By Links.
We want to know which pages have links, but, we just need to know Referring Domain count – we don’t care about seeing individual links for this project.
Since Ahrefs has released internal link data in Site Explorer, pull that, too. We’ll save ourselves a site crawl and use that data for internal ranking improvements.
3) Pull Page Value from Google Analytics.
This works a heck of a lot better when the company has a GA account with accurate data (meaning somebody set up Goals with tracked monetary value, or eCommerce tracking with accurate cart values).
If you don’t have GA access, you can use a raw substitute like keyword CPC, but you won’t be able to get data nearly as customized to optimize organic traffic for your *actual* conversion funnel.
Step 1B: Merge The Data
Once all 3 of these data sources are pulled, you’ll want to build a spreadsheet with 4 tabs. Leave the first tab blank, add each of the above data sections to the next 3 tabs, and now we’ll start the process of combining the data sources together.
Note: I’m in the habit of doing some of these tasks manually so that I can explore the data in Ahrefs and Google Analytics a bit before exporting it. I’ll often do this during the onboarding process as we’re getting to know the client’s data. But, you can make some of these easier using tools like URL Profiler which can also grab link metrics from Ahrefs, GA values if you have site access, and factors like word count and readability. You’ll still need to fetch rankings from Ahrefs Organic Keywords for the site manually.
Our Example Site For This Tutorial
For the rest of the post, I’m going to use Insteading[dot]com as an example site, because it’s a domain we own and it’s easy to share data for this post if we need to. It’s also gone through some recent traffic fluctuations in 2018 because of thin legacy content, so it’s a good candidate for both content upgrades as well as content pruning, though we won’t focus on pruning in this post.
It’s not quite as good of an example for this post as an eCommerce site since we don’t have any cart transactions to track for page value, but we can use a proxy like the keyword’s CPC to estimate the rough affiliate potential of a keyword. We’ll set page value to be, say, 10% of CPC value to account for that. If you’re doing this type of analysis for a prospective client, or a client you don’t have page data for, this is one way to guess at page value, but I would take any CPC-driven opportunities with a large grain of salt.
So, here’s what our tabs look like:
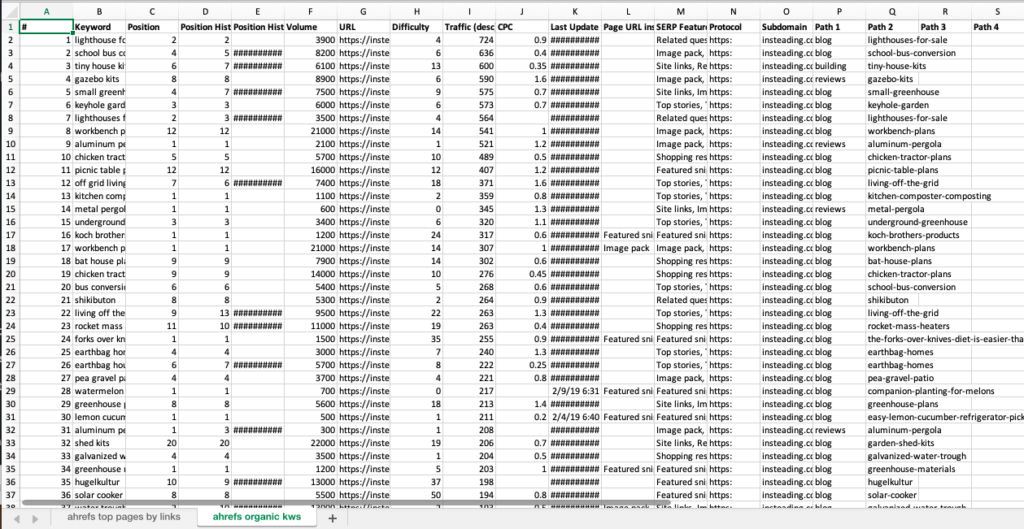
Note: In the screenshot above for Top Organic Keywords, I have added Protocol/Subdomain/Path1/2/3/4 Columns to the end to make it easier to analyze opportunities by subfolder section of the site. All you do to get this is Paste the URL column at the end of the table, then use Text To Columns under the Data section of the Excel ribbon, and split columns by the forward slash character “/”. If you have parameters used on your site, spit those out by “?” first, name the column parameters and move it left of the raw URL, and then perform the split by “/”.
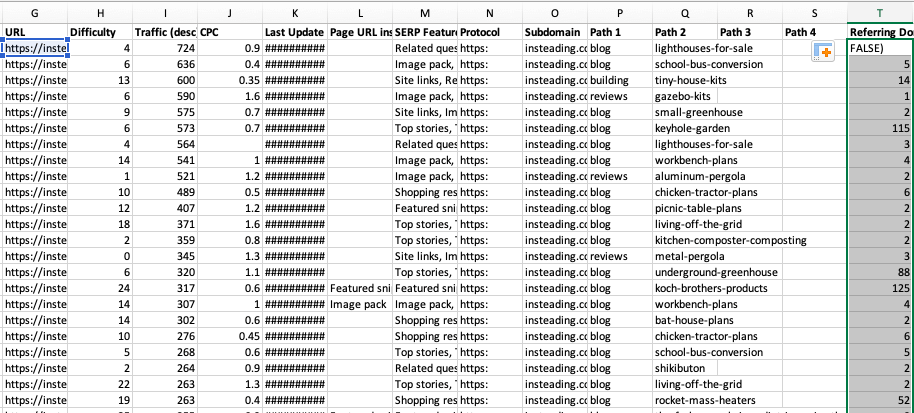
So now we have a couple of ways to combine this data. One way would be to pull the link data into the organic keywords tab. This is fairly easily done with a VLOOKUP like this:
=VLOOKUP(G2,'ahrefs top pages by links'!C:E,3,FALSE)We have a few hundred thousand rows so this will take a second. If you’re doing this on a full million row Excel document, your data may take a minute or more. If you start getting into VLOOKUPS that take 10-60 minutes then Excel isn’t the best tool – you should be using an application like Tableau or PowerBI or similar options.
Step 2: Prioritize opportunity based upon volume or value.
Now that you have all of your data in a single worksheet, it’s time to figure out the best way to prioritize the data.
We already have a few key data points that we’ll be using to calculate new metrics:
| Metric | Description |
| Keyword Volume | Ahrefs estimated volume, adjusted from Adwords data using clickstream data |
| Position | Ahrefs tracked ranking for our URL |
| Keyword Difficulty | Ahrefs assessment of average number of links to page ranking on page 1. We’ll compare this against our Referring Domains figure from the Links data we exported. |
| CPC | Adwords Cost Per Click delivered by Ahrefs |
| Traffic | This is the best number we can get out of Ahrefs to understand CTR for the keyword we’re analyzing, so this will come in handy. |
We’re going to create a few new columns for this as follows:
Potential Traffic & Traffic Increase
Potential Traffic = [Traffic] * [Position]
Traffic Increase = [Potential Traffic] – [Traffic]
Potential Traffic is a rough metric. We’re trying to take advantage of the fact that Ahrefs has already factored a CTR curve into their Traffic estimate for our current position. We’re also going to assume that every position offers traffic improvements over the position underneath it. It basically models a CTR curve where position 1 gets double the clicks of position 2, triple the traffic of position 3, etc. But I believe it still retains some of the root data from Ahrefs that downplays traffic estimates on lower CTR keywords.
So in this case, if we’re getting 2,000 estimated traffic at position 2, we’re estimating that we’d see 4,000 clicks at position 1.
If we’re getting 2,000 estimated traffic at position 11, we’re going to estimate that we’d be seeing 20,000 clicks at position 1 for that keyword.
These are inherently rough numbers. I’m not trying to get exact figures here – I’m trying to create a relative potential for the keyword in order to compare it against other potential opportunities we could improve on the site in question. We’re ignoring so many long-tail keywords in an analysis like this, I think that overestimating the potential of a head term by a little bit probably ends up being a wash in the end.
If the fact that I’m using rough data here bugs you, there are a few ways you can get better data if you want to take the time to do so.
- One would be to pull CTR data from Ahrefs Keyword Explorer. This is easier on small keyword lists, but doable.
- Another could be to build in Google Search Console data that provides closer-to-reality-but-still-not-perfect CTR and Click estimates.
- A third option would be to send fancy gifts to the Ahrefs team until they start reporting “Clicks” data from Keyword Explorer through the Organic Keywords export in Site Explorer.
- Moz’s Keyword Explorer doesn’t report CTR on domain-wide keyword exports but if they did, they would be a good option here. You’d get less overall keywords to export but you’d still cover most of your big win head terms.
Current Value, Potential Value, & Value Increase
Current Value = [Traffic] * [Page Value]
or, without page value: Current Value = [Traffic] * [CPC]
Potential Value = [Potential Traffic] * [Page Value]
or, without page value: Potential Value = [Potential Traffic] * [CPC]
Value Increase = [Potential Value] – [Current Value]
This is an estimate of the rough value of ranking for a keyword based upon our current Page Value from Google Analytics (preferred), or based upon CPC.
Then we calculate the potential value based upon our Potential Traffic value from a minute ago.
If you don’t have Google Analytics data, CPC is one alternative value you can use here, but I’m way less willing to lean on it for decision making than Page Value.
Note: If you still want to estimate *some* value on pages with $0 page value or on keywords with $0.00 CPC, you can add $0.01 or 10 cents to the value to make sure that you’re not missing large traffic increases labeled as zero value.
Here’s what our 3 new columns look like in our master table:
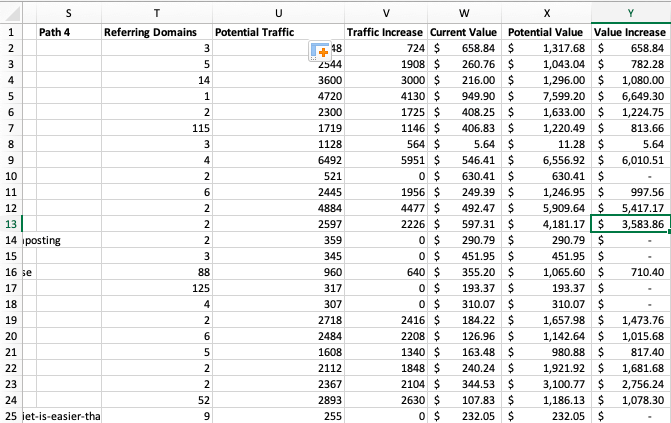
In the final table above we’re using CPC, so some of these potential value metrics are admittedly silly for the type of publishing/affiliate site we’re running. We’re not going to be able to capture that much value each month.
If we want to make the monthly numbers more realistic, dividing our CPC figures by 10 is a perfectly reasonable way to get a little bit closer to reality. However since the value represents “Monthly Value,” we might be looking at a reasonable estimate of the lifetime value of the page from the potential traffic increases, so that is a reason to leave the numbers as-is. Just make sure you know which is which if you show rough numbers like this to a client or stakeholder.
Yowza. That’s a lot of Excel so far, but, it’s not that bad. I can do the steps above in 5-10 minutes for most sites, it’s just wordy to explain the process in a blog post.
Let’s move on to the fun stuff! Most of the steps I’ve shown you so far are pretty basic. Now it’s time to start analyzing our potential, which is where the process starts to turn into valuable information.
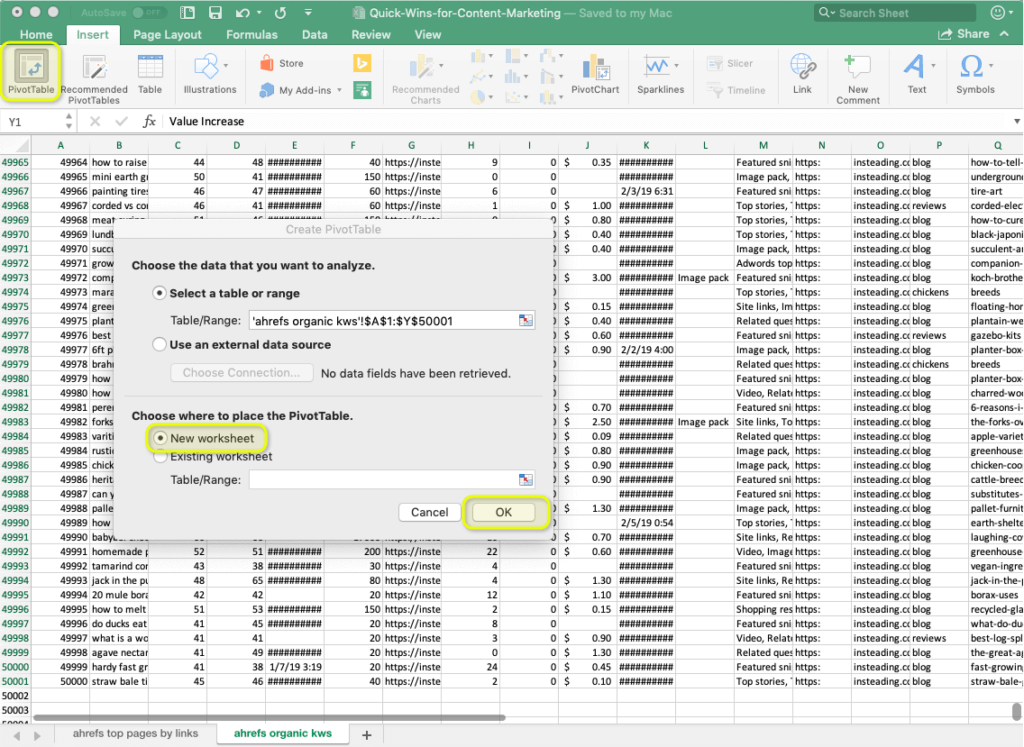
Let’s build our pivot table. Highlight your entire sheet of data and new metrics and put the pivot table in a new Worksheet:
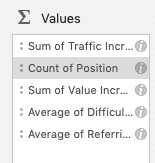
There are a few different ways we can analyze this data. I’m including the Pivot Table Fields on the right side of the screenshot so you can drag and drop and replicate, and then show you what our table looks like:
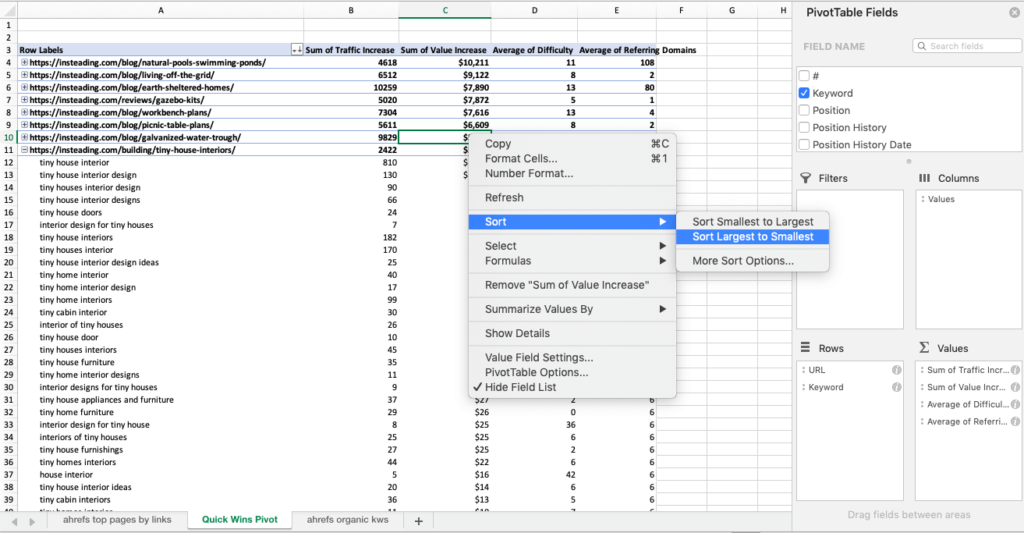
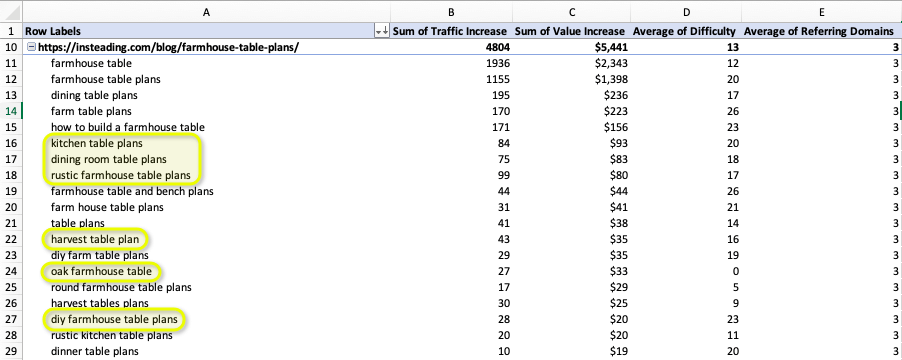
Here we have our full set of Site URLs, with secondary data underneath for keywords that each URL ranks for.
From there, we’ve added two columns for Sum of Traffic Increase and Sum of Value Increase. The first effectively estimates total traffic increase potential for the URL (with individual keyword-level increases shown below), and the second does the same thing with our value estimates. We’re also sorting the full table Largest To Smallest by the Value Increase potential. You need to do this on a URL level and again on a keyword level, so it will require sorting twice.
This is the basic core data we need to estimate which pages have the most potential to be increased, but we’re also going to add two columns for Average of Keyword Difficulty and Average of Referring Domains. This will basically tell us if we should expect good results from simply updating the content, or if we’ll need to build some links, too.
Step 3: Review content and identify improvements needed.
How To Analyze This Data
You don’t need to read too far into this analysis.
You could simply improve the content quality on each of the top 10-20 URLs in the list at this point and you’d see 70% of the results we’re looking for.
And that’s the first set of pages that you should focus on. But, you can do some sub-analysis on each page like the following:
1 – Use the Keywords List for Targeting Improvements
You can basically look at the top secondary keywords for each URL as a list of keywords that might need to be more closely targeted within the content. At a basic level, do your best to use each variation once.
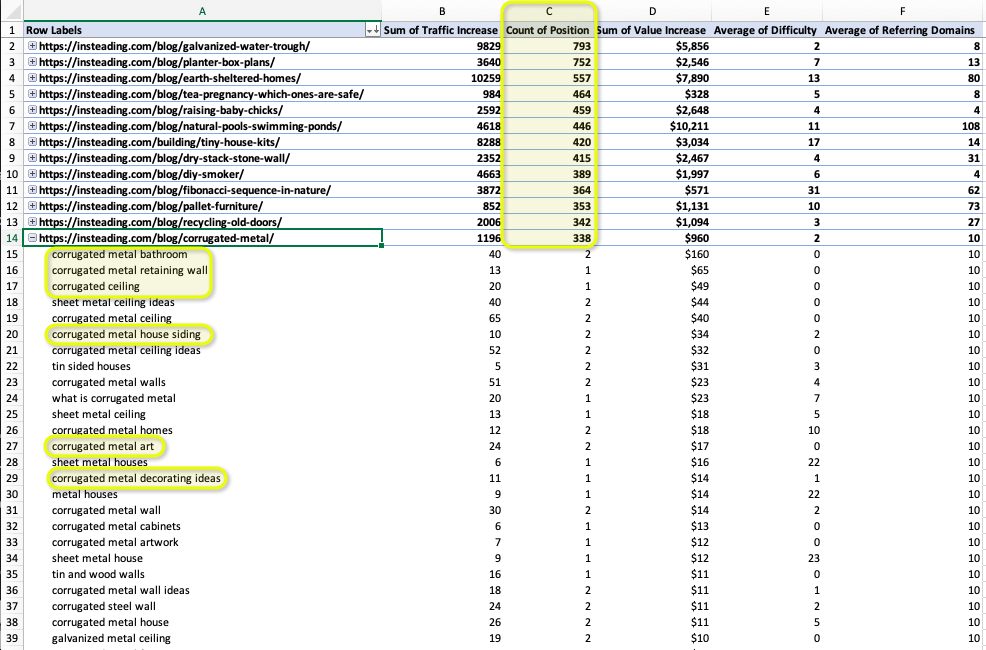
2 – Add “Number of Keywords” Data To Find New Spin-Off Content Opportunities
On a really popular page ranking for thousands of keywords, there’s a good opportunity to create some new long-tail content. The Farmhouse Tables screenshot above is a decent example – some of those secondary keywords definitely deserve their own new piece of content that is exact match targeted.
Add a new Field for Count of Positions to effectively see how many keywords each page is ranking for, then sort the new column Largest To Smallest:
In the end, however, the biggest thing you should do is sort this sheet by the pages with the largest traffic increase or value increase potential, and then we’re going to work through our three-part framework for improving rankings on the pages we’ve identified:
How To Act On Your Quick Wins Audit
- Improve Your Content – This is the easiest action to take. We’ll go through some methods in the next section.
- Building Internal Links – This is the next easiest way to drive more link equity to your newly rebuilt piece of content.
- Building External Links – If content improvements and internal link building aren’t enough to push the needle, our last set of opportunities is focused on building more referring domains that link to this particular URL.
Step 4: Improve the content
You’ll want to do a subjective review on the content and look for opportunities like the following:
- Go through your list of secondary keywords. Look for topics you haven’t covered well in the existing piece, and add sections of content that address them.
- Add length and word count on sections that are poorly explained. Word count alone isn’t a great metric to go by, but, we’ve rarely seen a case where taking an 800-word article and making it 2400 words didn’t improve rankings and traffic.
- Add strong H2/H3 article structure if one isn’t already in place. If the article order is a bit confusing, I wouldn’t be afraid of re-ordering some sections are rewriting the confusing parts entirely.
- Add screenshots, graphics, or examples throughout the post to bolster arguments and make the piece more visual.
- Look for non-competitor videos that might make sense to embed in the content.
- Look for new internal linking opportunities.
- Update any out-of-date information.
- Add Q&A sections that correspond to People Also Ask questions in search results, or top Quora topics (both of these are features in our new toolset).
We’ll elaborate on this section in a future post, but the most important thing is to look at the other sites ranking better than you and look for things that are missing from your content. If there are search result features like featured snippets and People Also Ask questions, structure your content to increase the likelihood of taking over one of those results, and so on from there.
A bit of a preview here – one of the core features of the upcoming software platform we’re releasing is helping your team audit the keywords that you’re trying to rank for and automate the process of finding these opportunities. Not just keywords you need to add to the content, but entity analysis, questions, visual content, and more.
Sign up for early access here:
Sign Up For Early Product Access
Step 5: Build new internal links
Search your website for the core keyword or related topics. A good search option is just doing [“keyword here” site:mydomain.com] and reviewing the top results in Google.
For each of the results you see that is relevant, find a good way to link in the body text to the piece of content that you’re trying to improve.
We’ll cover more ways to find internal linking opportunities in a future post, but here are some other good posts that elaborate in the meantime:
- https://cognitiveseo.com/blog/18796/internal-linking/
- https://www.orbitmedia.com/blog/internal-linking/
- https://www.iqseo.org/building-internal-links-for-seo-wins/
Step 6: Build new external links
Building new offsite links are the last option we use – updating content and building internal links tend to be way easier and it’s more cost effective to start there.
That said, you rarely need 100 new referring domains to be competitive in a quick wins analysis because it’s by definition focused on content where you’re already doing pretty well.
Guest posting is a great place to start. Building links through guest posting can be slow and tedious and it’s not always our first choice of link building approaches. But, when you’re leveraging the time spent on it by building links to high priority pages of content on your site like the ones you’ll identify in your quick wins analysis, then you’re leveraging your guest blogging time and effort way more effectively.
Guest posts are also a great way to grab a link to eCommerce product/category pages that don’t earn links organically themselves…
.
Aside from guest posting, it also makes sense to do some basic content promotion outreach and look for related pieces of content that are naturally earning links you could replicate. Again – 1 or 2 links or referring domains here will usually go a long way.
One way to use the analysis we built above to analyze link building requirements would be to add a Net Links calculation. Ahrefs uses a 0-100 scale for Keyword Difficulty, so it’s not a perfect representation of the number of links to the average result on page 1.
But if you look at the scale, Keyword Difficulty roughly scales like this:
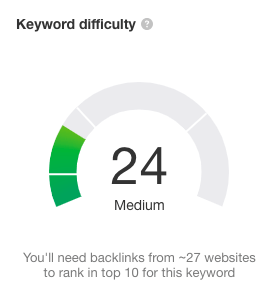
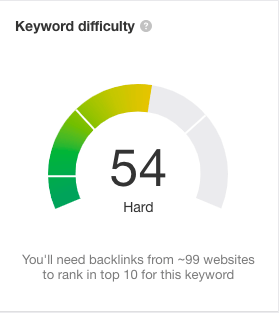
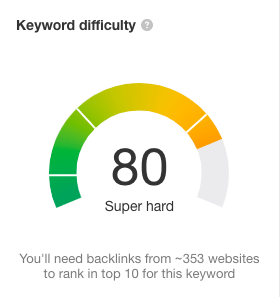
So, with this rough conversion rate in mind, we can build an Excel formula like this:
Links Needed = (([Keyword Difficulty] + 15) / 20) * [Keyword Difficulty] – [Referring Domains]
OK, what exactly is this formula doing?
We’re taking the Ahrefs KD scale and turning it into a multiplier. By adding 15 and then dividing by 25, we turn a 0-100 scale into a 1-6 scale. We’re adding 15 so that not as many results comes back with decimal results under 1.0. So KD 75 gets turned into 3.6. KD 24 gets turned into 1.6. If this doesn’t make any sense, don’t worry about it.
The important thing to know is that we’re editing Ahrefs KD to spit back mostly larger numbers so we can estimate how many links we need.
So here’s what your new Links Needed metric would look like:
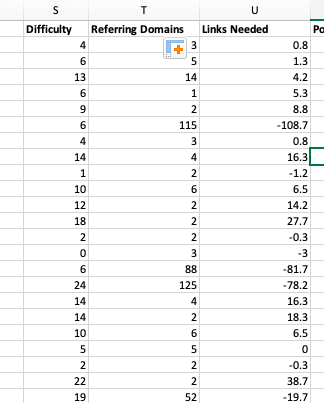
What’s cool about this is we can use it in 3 ways:
- We can sort by smallest to largest to find opportunities where we probably don’t need links. If Links Needed is negative – we’re already probably the largest linked page on that keyword! Likewise, if Links Needed is close to 0, we probably will see solid results from content improvements alone.
- We can sort Difficulty by largest to smallest and find existing content that is ranking in a link-heavy space. If our content is similar to the type of content earning lots of links in this particular keyword set, if we can find a way to make our content better than everyone else’s and then conduct outreach, we probably have a strong potential link building resource on our hands. Even if we manage to build 10-20 new links and don’t move any rankings on that URL – who cares? We just found an untapped link building asset on our domain.
This Is Just The Beginning
I’ve already mentioned some cool ways you can expand this analysis, but here’s a list to get you started.
- Substitute Ahrefs link/keyword data for Moz or SEMRush data and look for other opportunities that didn’t make it into your first analysis.
- Add in different types of conversion data to optimize for different outcomes (shopping cart conversions vs lead gen forms vs email subscriber signups, etc.)
- Add in Google Search Console data to better compare against other keywords and Clicks that 3rd party tools won’t tell you about.
- Pull in word count data from a site scrape to find thin content that is underperforming.
- Pull in internal linking data to find under-linked top performers.
- Pull in Adwords conversion data on these keywords to understand potential conversions by keyword that may not be properly represented in your Page Value data, eg if you’re sending PPC traffic to a separate landing page.
- Pull
Please comment with additional ideas!
Wrapping Up Your Quick Wins Analysis
There are undoubtedly some improvements to all of the processes I describe in this post, but I’ve focused the content on the easiest approach to get 80% of the results. Every business we work with is different, and the way you do this analysis for an enterprise SaaS company compared to a midsize eCommerce company will need to differ to fit that organization.
Conduct this type of quick wins audit every 6 to 12 months after you kick off on a project, as ongoing rankings changes and new content that is suddenly ranking on page 3 for lots of keywords will present new opportunities for quick wins in the future.
Also – here’s the XLSX file I used for this post so you can play with the pivot tables and other data.
I’ve removed the VLOOKUP formulas in order to keep the data static, but you should be able to replicate some of the queries I used. Columns may have changed in each case. There’s no proprietary data in there that you couldn’t pull from any Ahrefs report, so try replicating this on a site that you work on and feel free to leave questions in the comments.
Want to see how Content Harmony helps you build content that outranks the competition?
The blog post you just read scores Good in our Content Grader for the topic "content marketing quick wins".
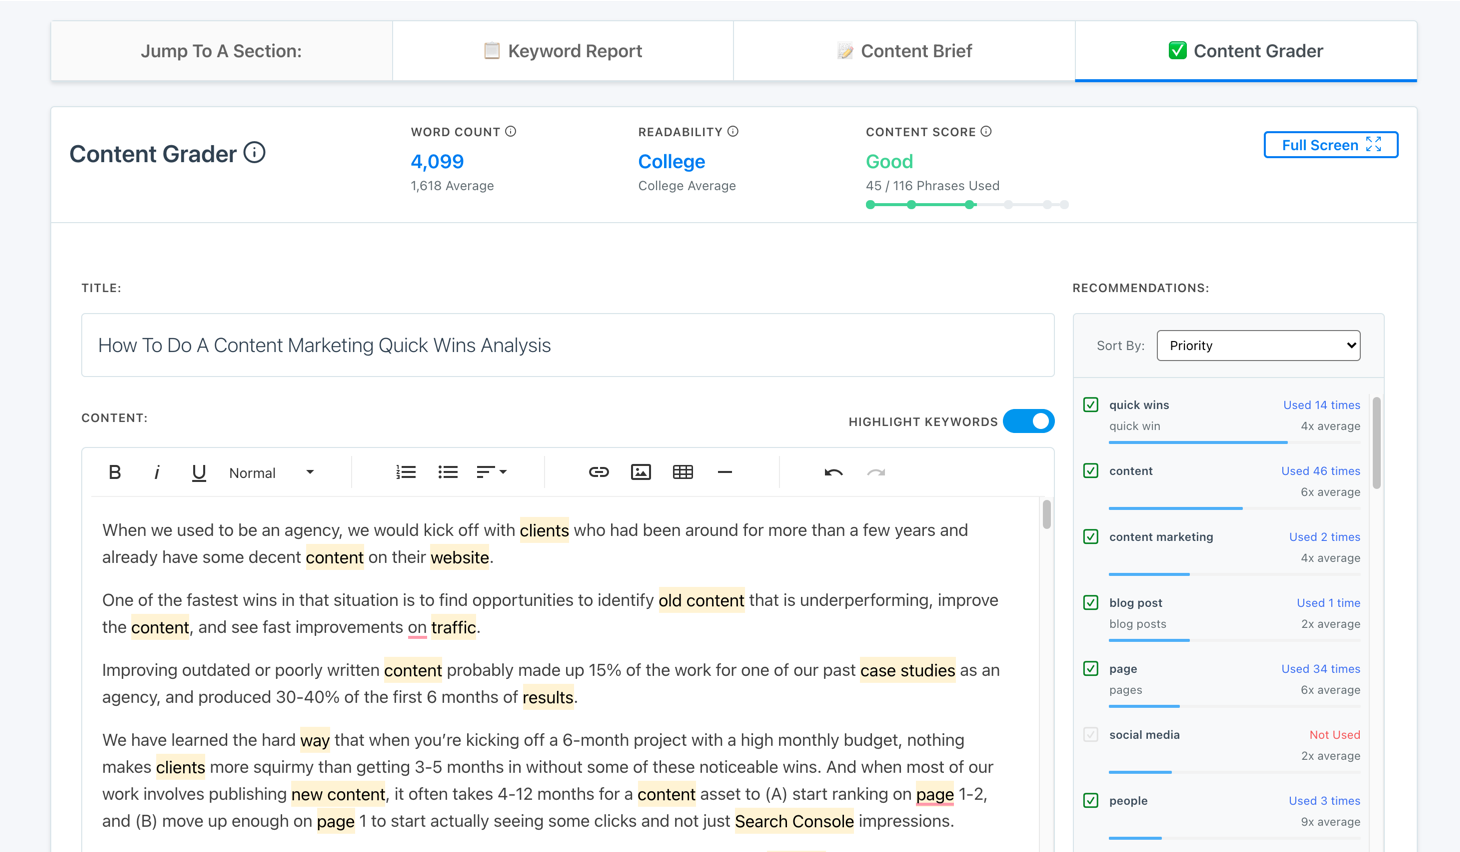
Grade your content against an AI-driven topic model using Content Harmony - get your first 10 credits for free when you schedule a demo, or sign up here to take it for a spin on your own.
✉️ Get an email when we publish new content:
Don't worry, we won't bug you with junk. Just great content marketing resources.

Ready To Try
Content Harmony?
Get your first 10 briefs for just $10
No trial limits or auto renewals. Just upgrade when you're ready.
You Might Also Like:
- 6 Content Marketing Exercises Inspired by Design School
- 10 Email Marketing Tips for Content Marketers
- Content Marketing Budget Examples For All Business Sizes
- A Complete Freelance Hiring Checklist For Marketers
- How To Produce Great Conference Coverage
- 5 Skills Brands Need To Learn From Publishers
- Email Split Testing Ideas
- How To Optimize eCommerce Product Pages
- How To Optimize eCommerce Category Pages
- This Is What Great Content Looks Like
- Content Success Factors for SEO
- Keyword Research for the Complete Customer Lifecycle
- 8 Reasons Journalists Make The Best Content Marketing Writers
- The Hourglass Sales Funnel
- eCommerce Blog Examples That Can Actually Generate Sales
- What Is A Content Brief (And Why Is It Important)?
- How To Update & Refresh Old Website Content (And Why)
- How to Create a Content Marketing Strategy [+ Free Template]
- How To Create Content Marketing Proposals That Land The Best Clients
- How To Write SEO-Focused Content Briefs