
This blog post is converted from the slidedeck of a presentation I’m giving today for the Seattle Tech Forum in Bellevue, WA. The presentation slides are embedded in the beginning, and the text that follows is the same content as the slidedeck, with added commentary similar to what was said in person.
Introduction
So, the purpose of this presentation is to take a look at a range of internet marketing statistics and trends, focusing on the following areas:
- Organic Search
- Paid Search
- Social Media
- Email Marketing
From there, I’m going to talk a bit about:
- How the adoption of mobile and tablet devices are affecting us
- Changes in priorities, budgets, and ROI measurements for marketing departments
- Where I see the near future of internet marketing, particularly outside the marketing department
In other words, this presentation if for a wider audience than the usual online marketing crowd.
Here are the slides (lacking my awesome custom fonts, however, which slideshare can’t process):
Now, let’s look at some trends:
Organic Search Trends
Google vs the World:
As reported by Comscore in Dec 2012, Google now accounts for 65.2% of searches worldwide. That’s searches, not searchers.
Google vs. Binghoo:
The U.S. market is similar, with Google getting 66.9% of searches in October 2012 as reported by Comscore.
Core Search Entity | Explicit Core Search Share (%) |
Oct-12 | |
Total Explicit Core Search | 100.0% |
Google Sites | 66.9% |
Microsoft Sites | 16.0% |
Yahoo! Sites | 12.2% |
Ask Network | 3.2% |
| AOL, Inc. | 1.8% |
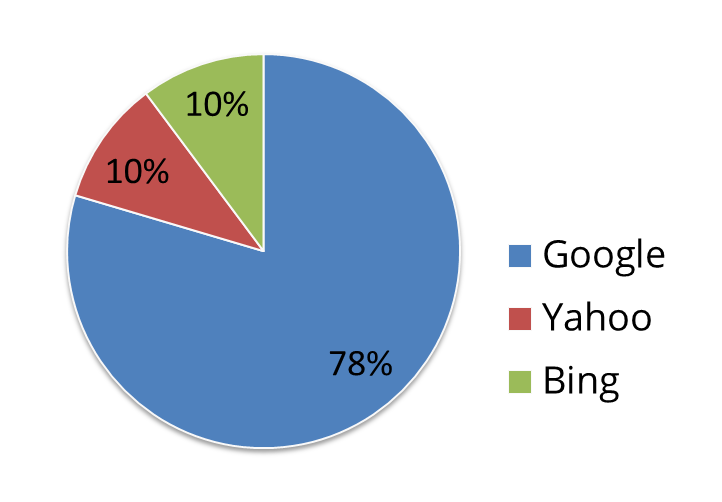
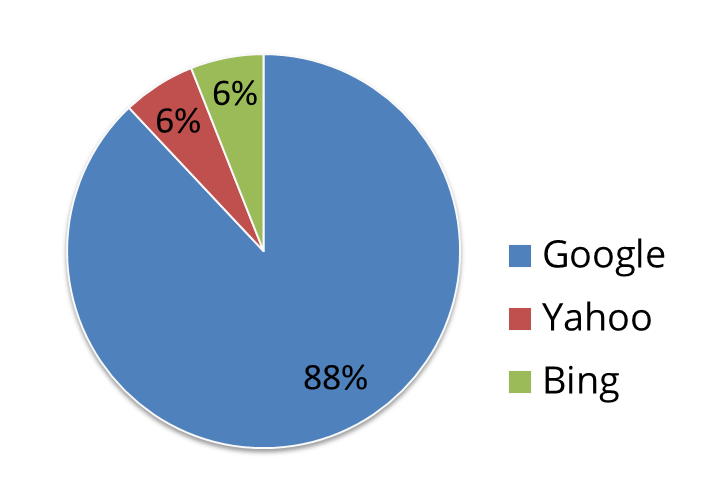
That’s not the end of the story, though. 2 private studies have shown a much larger percentage of search visits coming from Google.
RKG reported 78% of search traffic coming from Google in a Q4 2012 study of their clients:
Optify reported even higher numbers for a similar study of their B2B clients (PDF link), with 88% of search visits coming from Google:
3 Major Search Engine Trends in 2012
1 – Google’s Continued Fight Against Spam:
Penguin in 2013, and Panda continuing from 2011, both led the fight against spammy links (Penguin), and spammy and weak content (Panda).
Results are mixed – worst offenders have been suitably punished, however many have moved to slightly less crappy link building and content practices, resulting in the bar only getting raised slightly in many markets. Other markets might as well not be affected by Penguin, based upon the tactics we see working daily.
2 – Continued Loss of Keyword Data to (not provided).
- For clients of Content Harmony (skewed towards small/medium businesses), we’ve seen 30-40% of keywords become (not provided).
- I’ve seen reports upwards of 50% for tech-friendly audiences.
- RKG Q4 report said 28% average.
- Optify B2B report said 41% average.
This has been a large driver in changing organic search metrics in my opinion, along with personalization of search results. We’re not forced to focus on landing pages and aggregate keyword data as opposed to microlevel focus on keyword performance.
3 – Emergence of Google Authorship
Authorship has 2 big implications:
- What is happening now. The only thing we’re fairly certain about with authorship is that it typically offers higher click through rates than the same ranking without authorship. This allows for better results for content producers that adopt it sooner, and is already rewarding companies that are producing content that is attributable to high-profile individuals.
- What might be happening now, and what could happen later. This is the real area of opportunity. The implications of authorship allow for brands and authors to increase rank through building followers. Moreso, it allows brands to draft on the following of authors, and authors to draft on the following of brands. I also think the implications for spam detection are positive, because faking an entire social following on Google+ will be much more difficult to scale than current link and social share metrics. The ROI of building a brand becomes better than the ROI of building fake identities and spamming the networks.
Paid Search Trends
I don’t spend too much time doing paid search. With that qualifier, the big opportunities I see in PPC are for targeting to segments like tablets and mobile, and moving outside of Adwords and looking at alternatives such as retargeting and Microsoft/Yahoo advertising.
PPC now accounts for around 25% of search clicks, with 75% going to organic.
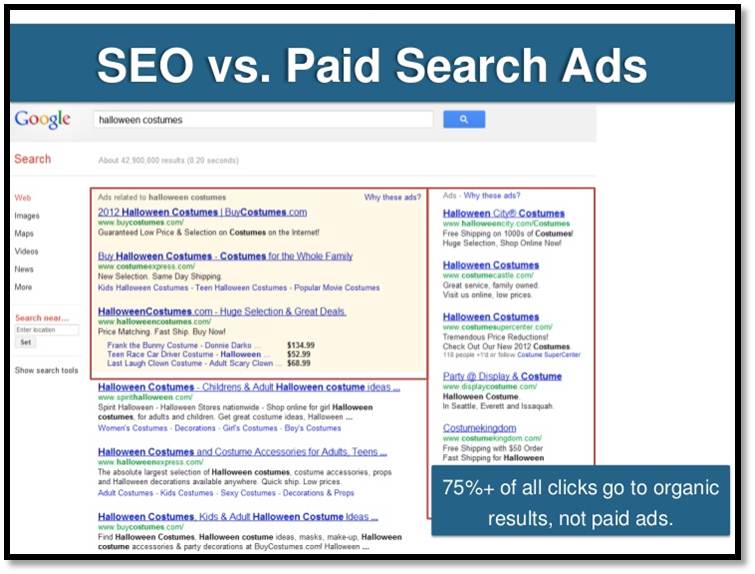
Data and screenshot from presentation by Rand Fishkin and Darmesh Shah.
There are interesting opportunities in the tablet PPC market, for example:
As reported by Adobe, one study showed a similar click-through rate for tablets and desktops. However, due to a lower cost per click for tablets, and a slightly increased conversion rate for tablets, they found a 68% higher ROI for tablet PPC over desktop PPC.
***UPDATE*** A couple PPC folks pointed out to me that due to very recent “enhanced campaign” changes in the Adwords platform, this type of device targeting will be restricted for tablets (Thanks Lisa Sanner of PointIt and Michael Wiegand for chiming in).
This MediaPost.com article describes the changes in more detail. I’m not sure why on earth Google would do that instead of focusing on raising PPC costs for tablets in general – seems like this will only annoy their biggest source of income. Any thoughts from more experience PPC professionals? The MediaPost article mentions this quote from Richard Zwicky of BlueGlass Interactive:
Optimism over what this could signal remains high, though. Richard Zwicky, CEO and Chairman of BlueGlass Interactive, believes the changes make strategic sense for Google, though acknowledges this is an aggressive first step. “If you take a long-term perspective, Google’s Enhanced Campaigns launch may indicate their belief that the decline in desktop search – first seen in October 2012 – is going to become an even stronger trend. If this is the case, its move to do away with differentiation between mobile and desktop AdWords is quite logical and a well-thought-out, strategic move toward tomorrow,” he says.
“[M]ake no mistake, AdWords had to change. Google either had to move ahead of the [mobile advertising] market, or watch another company appear and force the issue. They chose the more aggressive route.”
Social Media Trends
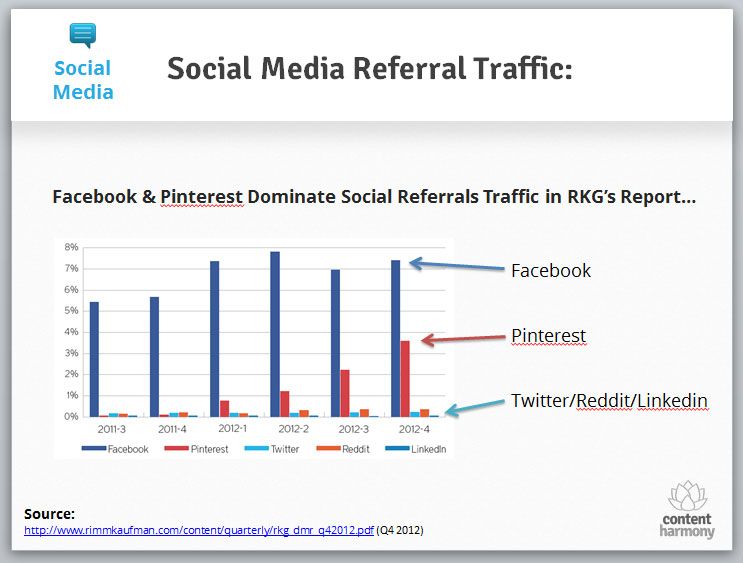
The RKG report showed the vast majority of social referrral traffic for their clients coming from Facebook and Pinterest. I’m very surprised at the low levels for Twitter, which makes me question whether their clients skew in any particular direction.
In addition, the Optify B2B study showed a different trend for B2B businesses:
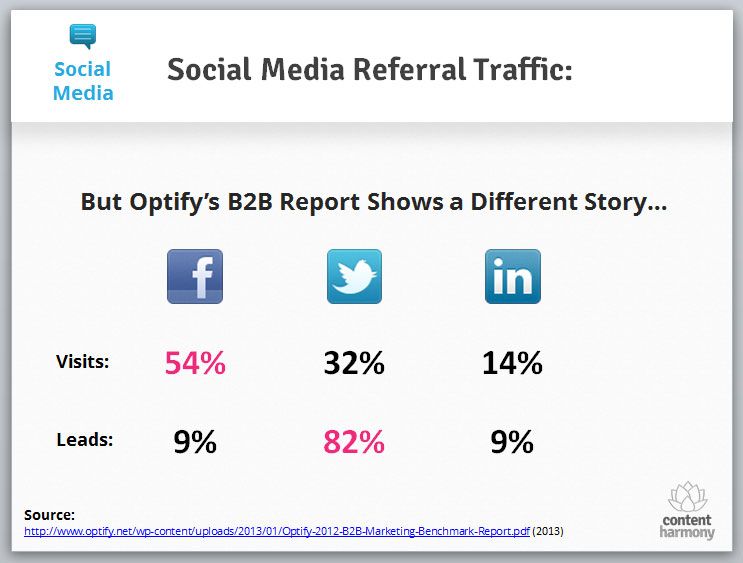
Interestingly, despite only sending 32% of social media referrals in their study, Twitter accounted for an outstanding 82% of leads generated from social media referral traffic.
Facebook For Business:
On average, 6% of Facebook fans engage with brand pages via likes, comments, polls, and other means. The average engagement was less than 1 Like over the course of the eight weeks.
This data comes from a recent study by Napkin Labs that was featured on Mashable. Some notes on how the study was conducted:
Napkin Labs analyzed fan engagement for more than 50 brand pages, including consumer electronics companies, retailers and more, with between 200,000 to 1 million fans each. The researcher found that having more likes doesn’t necessarily mean having more engagement. In fact, the more Facebook fans a brand has, the lower the percentage of engaged fans tends to be. For example, brands with between 900,000 to 1 million fans had 60% less engagement than brands with 500,000-600,000 fans.
Paid Social Media Ads:
A study by Vizu/Neilsen found that in-house advertisers are using paid social media ads more for branding (awareness) than direct-response (sales).
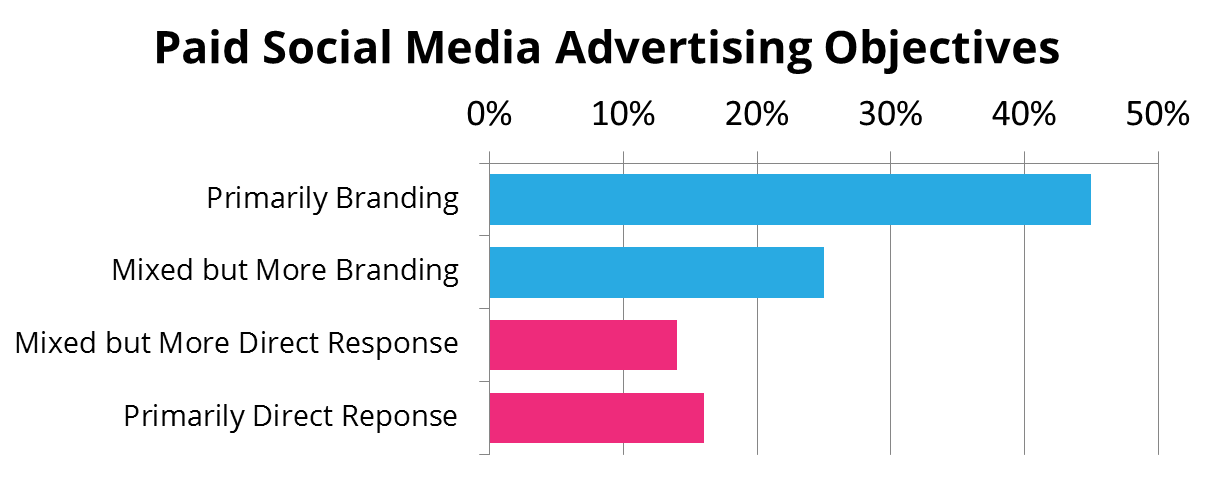
Agency marketers responded similarly, but not quite as weighted towards branding, and more heavy on both Mixed categories.
Email Marketing Trends
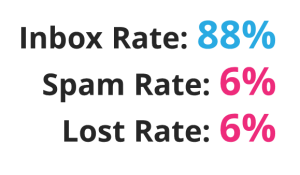
This data comes from a report by Return Path on commercial email benchmarks, for Q4 2012:
Delivery Rates:
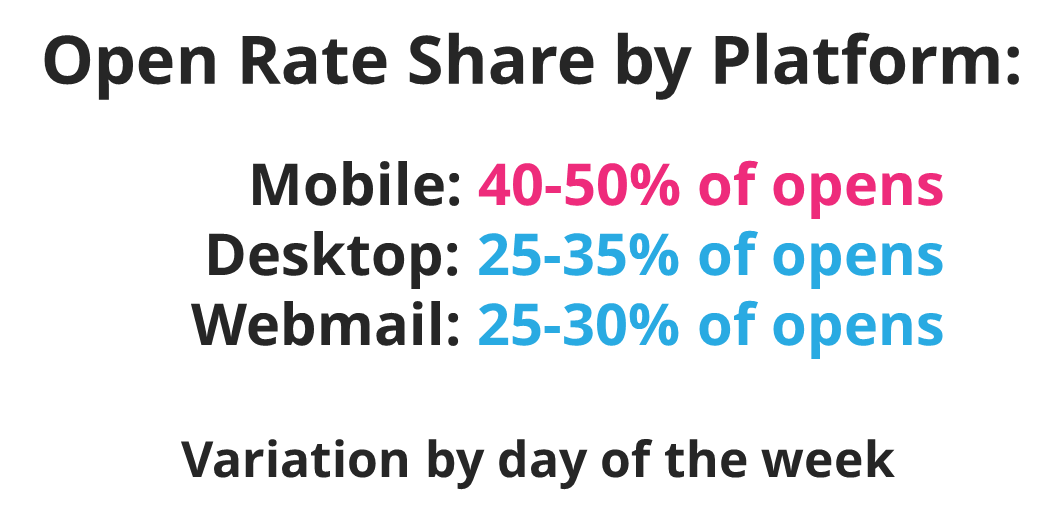
Open Rates:
Email Read Rates:
According to Return Path the average read rate for commercial emails was 17% by Q4 2012.
Here’s what read rates looked like by industry, with year-over-year change highlighted.
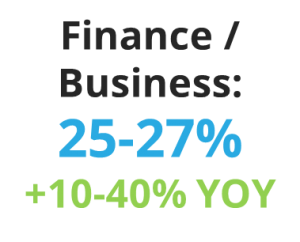

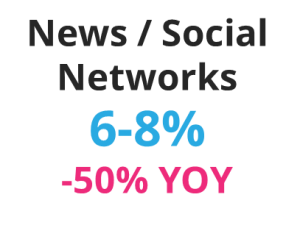
You can see that social networks and news sites had the worst performance – if you’re working in that segment, you’d better start delivering more value in each email.
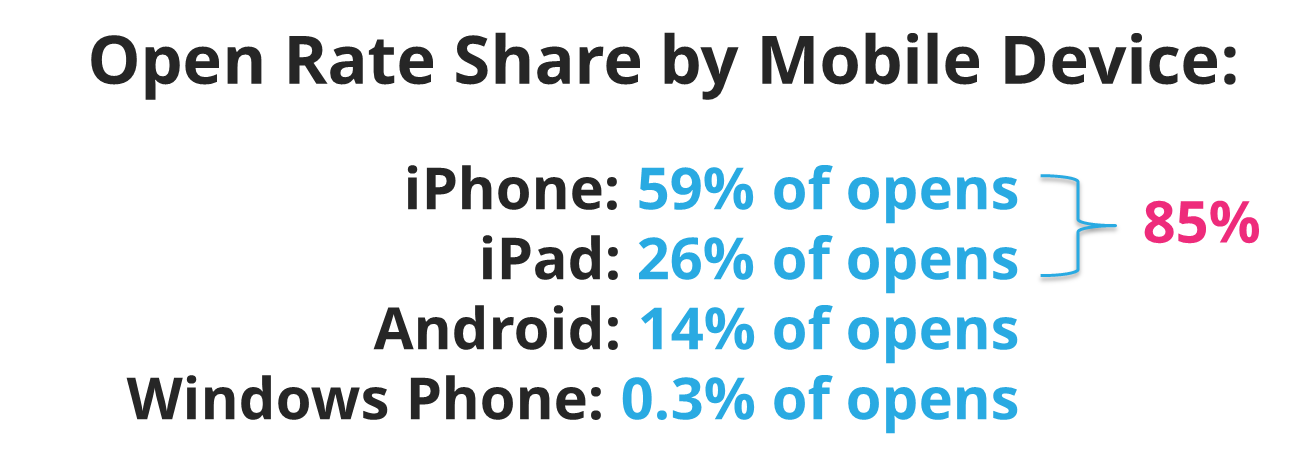
Mobile & Tablet Adoption & Trends:
According to data from Cisco, the number of mobile devices will exceed the world population this year. We’ll hit 1.4 mobile-connected devices per capita by 2017.
Rimm Kaufman’s Q4 2012 study showed that their clients saw 25% of Google search visits coming from mobile devices that quarter. However, it was only 19% for Yahoo search traffic, and 6% for Bing search traffic.
I personally would speculate that this is a result of Google being the default search engine on all Apple and Android devices. Most users don’t care enough to go out of their way to change that default.
Tablets Convert Well:
Tablets vs. Desktop:
An eConsultancy study found that tablet conversion rates for Cyber Monday 2012 were on par with desktop conversion rates.
Another study with smaller affiliate-focused data reported conversion rates almost double for tablet over PC.
I think that’s higher than normal based on a couple of private conversations with people working in ecommerce, but they have suggested that on par or +/- 10% is pretty accurate.
As mentioned earlier, ROI for tablet PPC can be much higher due to lower CPCs.
Tablets vs. Mobile:
The same eConsultancy study of Cyber Monday 2012 showed that tablets converted 4x better than smartphones.
Tablets By Time of Day:
No big surprise here, but a Get Elastic study (they produce tablet ecommerce sites) showed that tablet conversions are highest on nights and weekends. If you’re doing email or social media marketing, take this into account when scheduling content to go out at night and over the weekend.
Arggh! So Much Data! Where Do We Focus?!
eConsultancy did a few studies in late 2012 to find out where digital marketers were focused their efforts for 2013. Here are a few of the charts along with my commentary. Charts created by MarketingCharts.com, an awesome website that I used heavily in creating this presentation.
Digital Marketer’s Top Priorities for 2013:
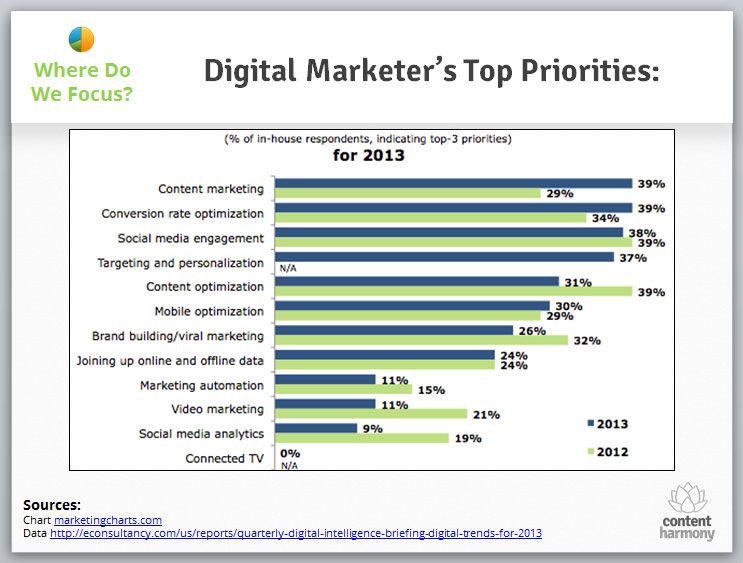
Top categories were Content Marketing, Conversion Rate Optimization, Social Media Engagement, and Targeting and Personalization, each getting 40% of repondents mentioning them as top priorities.
Which is great, but talk is cheap. What do their budgets reflect as their priorities?
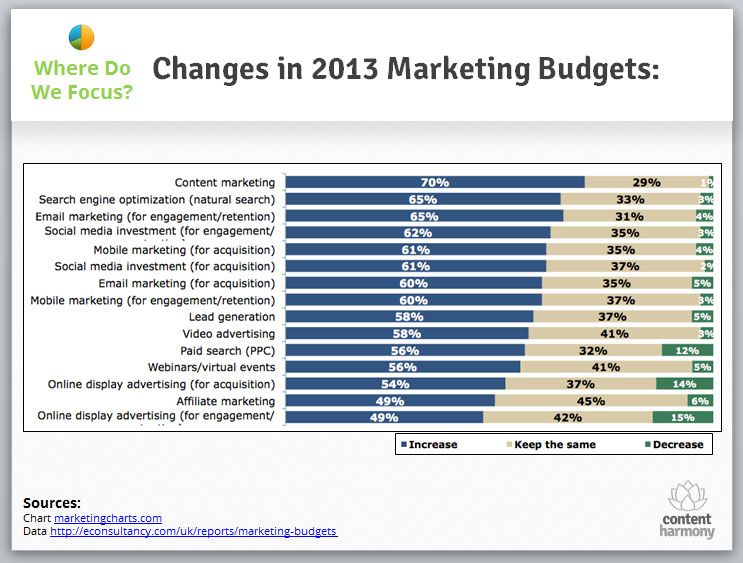
Boom. That’s the data I really wanted to see.
Digital marketing budgets increasing for at least 49% of respondents in every category.
65-70% of in-house marketers reported increases in content marketing, SEO, and email marketing for 2013 budgets.
Interestingly, the biggest reductions were in PPC and online display ads, both of which, in my opinion, tend to be fairly measurable in terms of ROI and conversions.
Speaking of ROI – How Are We Doing At Measurement?
Another eConsultancy study has been measuring digital marketer’s feelings on how well we understand ROI for the last few years. Take a look at Feb 2013 vs Feb 2010 – just three years ago:
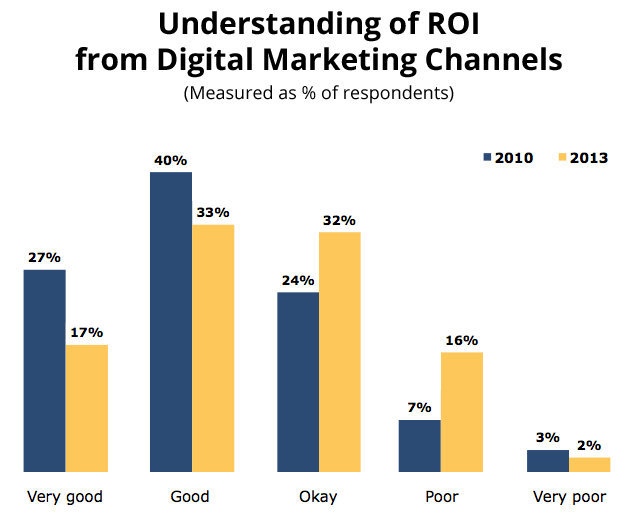
The number of people responding that their understanding of digital marketing ROI was Good to Very Good dropped from 67% to 50% over 3 years.
The number of people that said Poor to Very Poor jumped from 10% up to 18% over the same period.
But here’s the thing – while we don’t feel our understanding is great overall, we do feel that the ROI is above average in many channels. Take a look at this chart, without our reported feelings on ROI by channel:
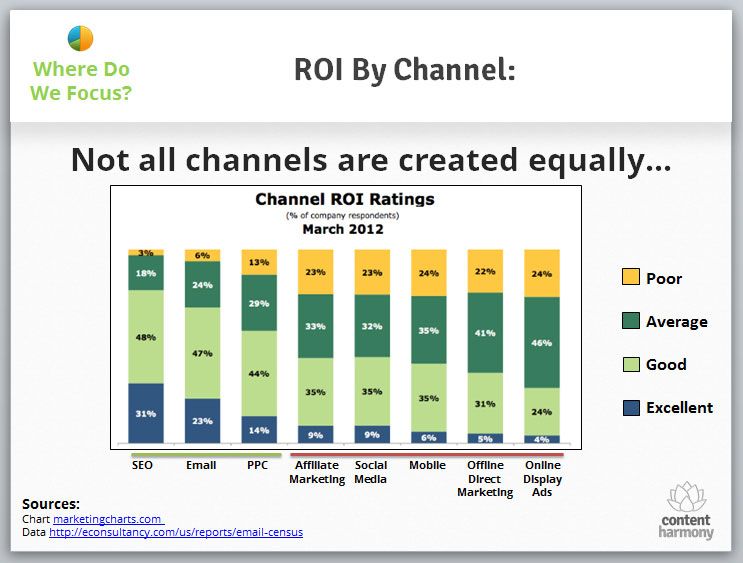
Yowza. Let’s take a deeper dive:
Number of respondents saying that a channel had good or excellent ROI:
- SEO & organic search – 79% of respondents.
- Email marketing – 70% of respondents.
- PPC – 58% of respondents.
Areas where less than 50% of respondents rated the channel’s ROI as good or excellent
- Online display ads
- Offline direct marketing
- Mobile marketing
- Affiliate marketing
Combine this ROI data with the 2013 budget data, and I think we have a good idea of where the internet marketing community is headed in 2013.
So What Changes Going Forward
This is the part where I start speculating based upon my own feelings of growing priorities. Here are the top 3:
1 – The Content Arms Race Heats Up
Companies have seen the light. To have any chance of competing in the organic search and social space, they need content. More and more companies producing more and more content results in one thing: a content arms race. It’s been happening for years, but now is when the stakes get higher, because poor quality content is quickly getting less and less useful for SEO, and even if it gets you rankings, it doesn’t convert.
The only choice companies have in competitive spaces is to be prolific or be profound in their content creation. Preferably both.
2 – Better Data Results in Better Marketing
I mean this in two ways:
First, better data gives us better performance metrics for marketing efforts. More and more larger companies are using business intelligence platforms to analyze performance across all business segments. The marketing department is no exception. From automated dashboard startups popping up left and right, to deeper diving applications like Tableau, we’re seeing data pouring into our marketing toolset just as fast as it’s pouring into every other department.
Second, I believe that data will be one of the defining characteristics of businesses winning the content marketing war within their markets. In fact, I’m doing an entire presentation on that concept in early March, and I’ll have a corresponding post here as well.
I’ve mentioned before that I believe using data is one key to earning respect, both for individuals and for brands. I think this needs to be a central part of marketing budgets, and needs to go far beyond simply producing infographics.
3 – More and More Companies Are Going to Turn to CRO
Here’s why I feel that way. It’s only getting harder and harder to stick out as more content gets produced by companies. We need to get better at converting the eyeballs we have, which in turn maximizes investments in traffic generation like SEO and PPC. As the CRO field matures more and gets more recognition, I think it will be just as common for established companies to have ongoing CRO teams/agencies, the same way they’ve ongoing SEO & PPC efforts.
✉️ Get an email when we publish new content:
Don't worry, we won't bug you with junk. Just great content marketing resources.

Ready To Try
Content Harmony?
Get your first 10 briefs for just $10
No trial limits or auto renewals. Just upgrade when you're ready.
You Might Also Like:
- How To Produce Your First Brand Style Guide
- 6 Content Marketing Exercises Inspired by Design School
- 10 Email Marketing Tips for Content Marketers
- Content Marketing Budget Examples For All Business Sizes
- A Complete Freelance Hiring Checklist For Marketers
- How To Produce Great Conference Coverage
- 5 Skills Brands Need To Learn From Publishers
- Email Split Testing Ideas
- How To Optimize eCommerce Product Pages
- How To Optimize eCommerce Category Pages
- This Is What Great Content Looks Like
- Content Success Factors for SEO
- Keyword Research for the Complete Customer Lifecycle
- 8 Reasons Journalists Make The Best Content Marketing Writers
- The Hourglass Sales Funnel
- eCommerce Blog Examples That Can Actually Generate Sales
- What Is A Content Brief (And Why Is It Important)?
- How To Update & Refresh Old Website Content (And Why)
- How to Create a Content Marketing Strategy [+ Free Template]
- How To Create Content Marketing Proposals That Land The Best Clients